
A version of this essay appears in Bill Mitchell’s Restaurant Leader’s Playbook.
Want to get the full step-by-step guide for transforming restaurant operations?
By Bill Mitchell, HungerRush CEO
It all starts with your menu
Once you have clarity on the operational performance of your locations, it’s time to dig deeper into another critical area: the menu. By analyzing your restaurant’s menu performance, it’s easy to uncover hidden opportunities to grow sales and profit margins while identifying items that need optimization.
Profitability is often hiding in plain sight. Years ago, at Dunkin’, sales data analysis identified coffee as a high-margin opportunity. At that time, coffee made up less than 40% of gross sales because the company positioned donuts at the center of the brand. By looking at the data, we realized that while donuts were a staple, they weren’t enough to sustain long-term growth. Customers only chose donuts once a week on average. But coffee was something many customers sought out multiple times a week, and for some customers, their morning coffee at Dunkin’ was a daily routine.
We decided to shift the focus of the brand away from donuts and toward coffee.
This was a major change across the organization. We changed the name from Dunkin’ Donuts to Dunkin’ and made all the necessary operational changes to support this decision. No area of the business went untouched, from marketing, customer experience, menu, and operations, and even the company’s tagline.
After repositioning coffee as the centerpiece of our offerings, it grew to account for over 60% of Dunkin’s revenue.
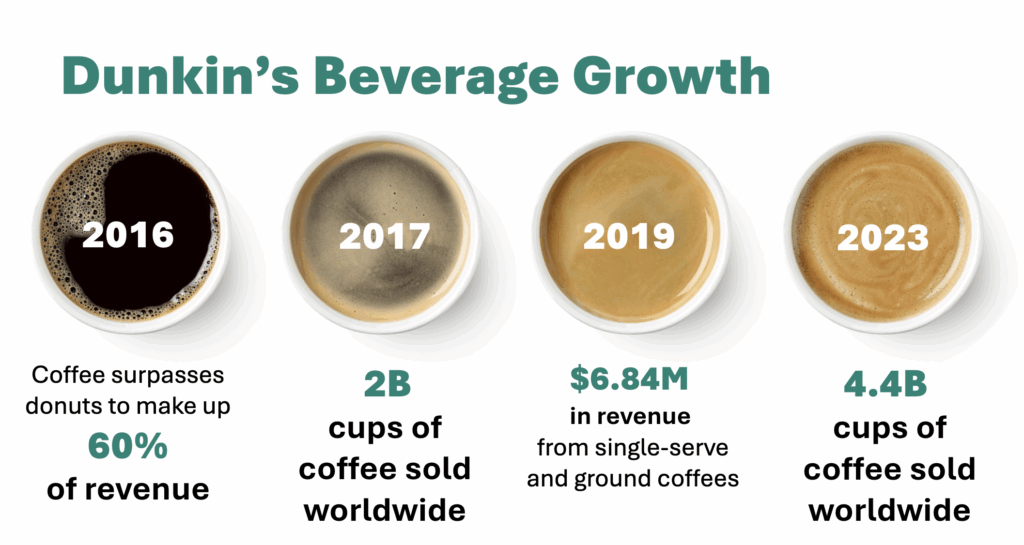
By 2021, Dunkin’ was selling over 4 bn cups of coffee a year, on par with Starbucks, and in some states it owned over 2/3rds of the coffee market. This shift not only had a major impact on gross sales for coffee, it also significantly improved profitability of the entire business.
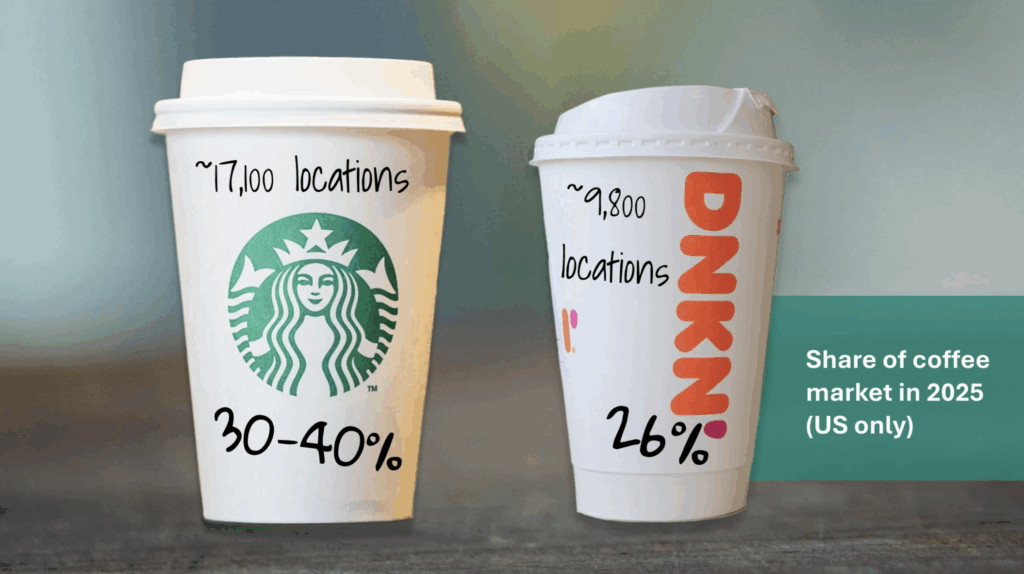
In 2025, Dunkin’s share of the coffee market in the US is just a few points behind Starbucks, despite having only 55% of the footprint.
Untapped profitability is hiding across your menu
Just looking at margins isn’t enough. For an all-encompassing restaurant profitability strategy, it’s important to use the opportunity of a menu review to analyze profit contribution by volume across all locations. If a shift in menu focus demands an entire brand overhaul, then so be it!
Review Menu Performance Data to Uncover Hidden Revenue
Instinctually, leaders know the general patterns and trends across their brand. But familiarity with general trends can be the enemy of truly knowing the specifics. It’s very easy to overlook how specific menu items perform regionally or where operational inefficiencies erode profit margins without digging into the data.
How do you move from the 10,000-foot view to the 10-foot view of your business? To capitalize on hidden opportunities across the brand, pull the sales volume and profit margin data for each menu item for every location. Review data for each location to identify where they are not performing up to the expected targets across the brand. And then analyze menu items across locations for further insights waiting in the numbers.
The table below represents sales volumes and profit margins at a single location. Review the same data across locations, by region, or for the entire brand to identify where to update menus in ways that will drive the overall profit margin, such as bundling items, removing unnecessary or poorly performing menu items, and running specials. Only have one location? This data is the key to your success.
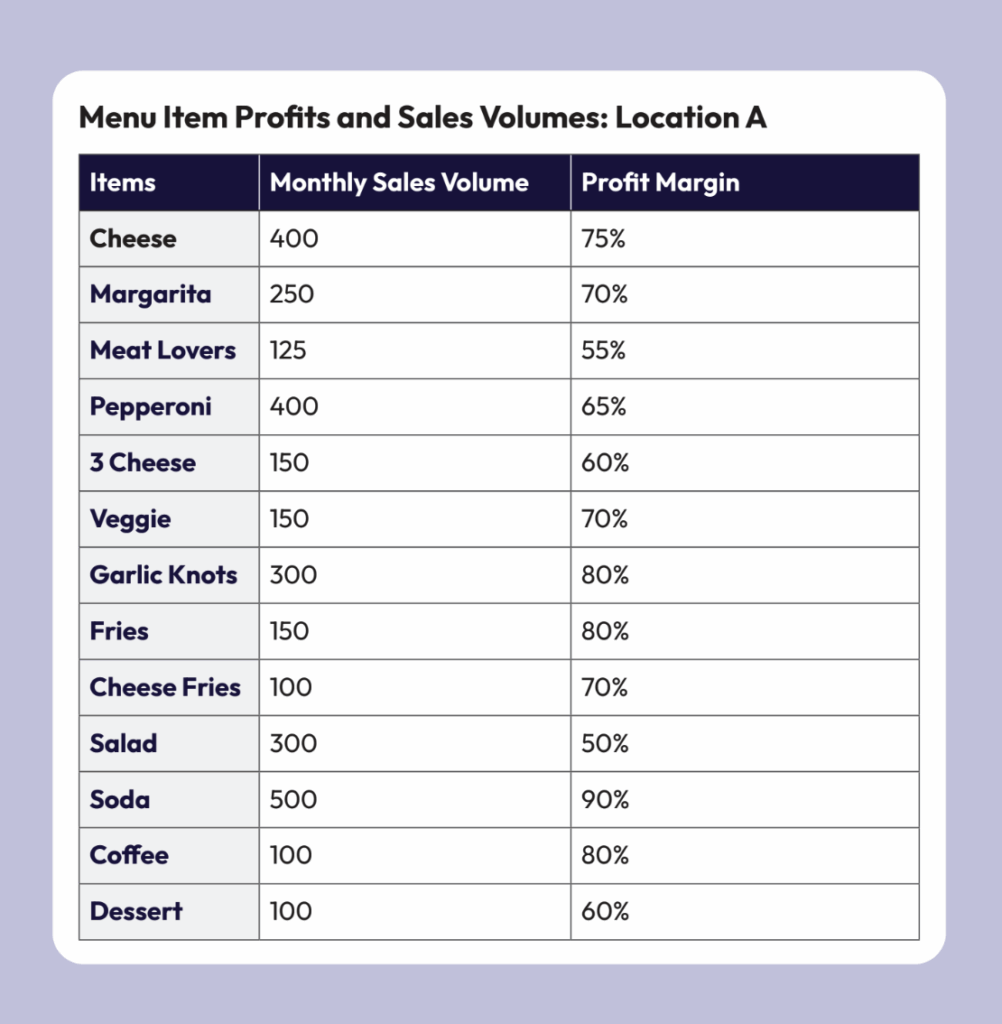
The matrix below represents the data from the table above. Plotted visually like this, it’s easy to see the menu items that are already driving profit (the upper right quadrant = high margins and high sales volumes), and the menu items that have potential to increase profits (the upper left quadrant = high margins and low sales volumes).
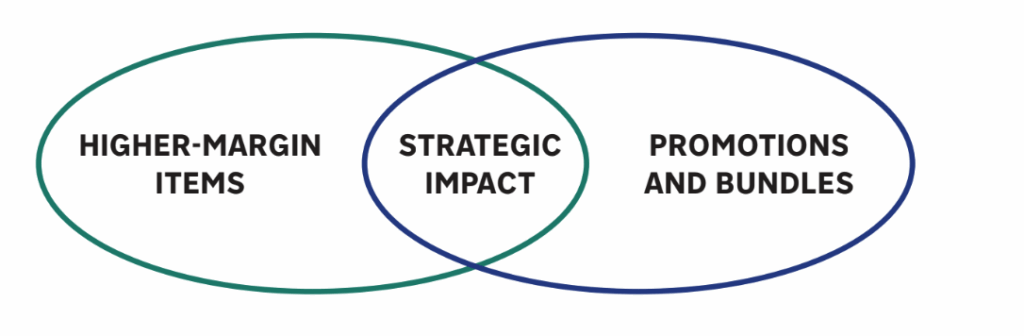
High Margin Items + Frequency = Profits
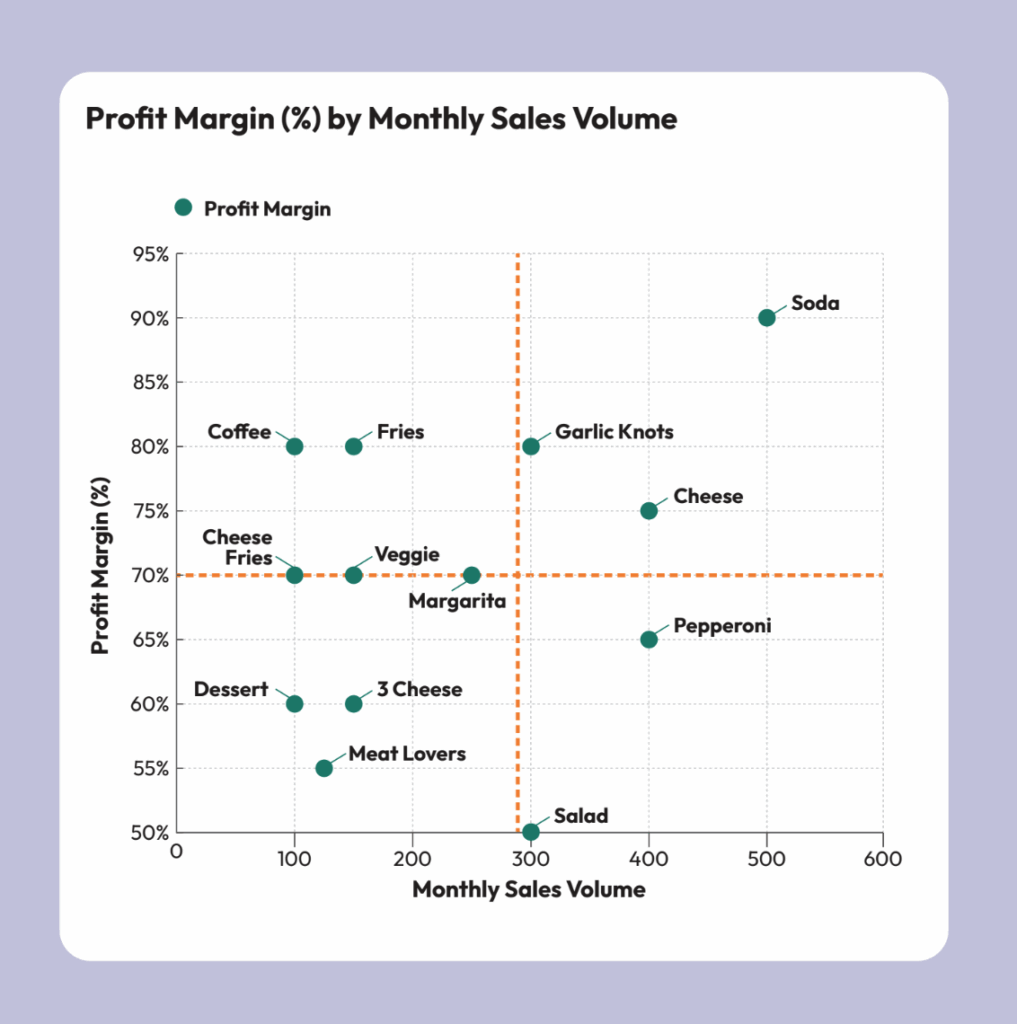
The matrix shows menu data for a single location. This operator would be wise to create an up-sell program or offer menu combos to increase sales for fries and garlic knots. What else do you see in this data that could increase margins?
Next, you’ll focus on what your customers are ordering—and how to make every order more profitable.
Your sales start with your menu
Maximizing your menu is about turning it into your secret weapon to drive higher order frequency and increase the ticket value of every transaction. By combining strategic menu design, pricing, and upselling, you can turn everyday orders into opportunities to boost both guest satisfaction and revenue. In pizza, for example, higher-margin items like beverages, sides, and desserts can have an outsized impact on profitability when strategically promoted or bundled with other menu items.
Menu Optimization Best Practices
Focus on three key areas to enhance guest satisfaction and revenue:
1. Remove complex, low-margin, and low-performing menu items
2. Create bundles or combos that offer high value to guests
3. Test limited-time specials that align with regional tastes and trends. Use location-based data to determine how to apply these strategies for targeted profitability.
1. 86 THE LEAST PROFITABLE ITEMS
Every item on your menu has a cost—whether it’s raw ingredients, kitchen prep time, or the mental energy required by staff to prepare and serve it. Yet, many operators hold onto underperforming menu items for far too long for a variety of reasons, ranging from old habits to feeling that certain items are central to your brand identity.
For example, in 2019, MOD Pizza analyzed menu data across 400 locations and realized that offering multiple sizes for a single pizza type created operational bottlenecks without meaningfully increasing customer satisfaction. By removing the less popular sizes, they simplified operations, reduced inventory costs by 12%, and improved kitchen throughput by 18% during peak hours. Are there items on your menu that create more complexity than they’re worth?
2. USE HIGH-MARGIN ITEMS IN BUNDLES
Bundling isn’t just about packaging items together—it’s about highlighting the right menu items in ways that drive both perceived value for guests and real profitability for your business.
Consider Domino’s “Choose Any Two” mix-and-match deal. Domino’s didn’t just bundle pizzas with drinks and sides; they carefully selected items that were operationally efficient: they were easy to prepare together and had high margins. Within six months of introducing the deal, they saw a 15% increase in ticket size across their U.S. locations.
Bundle Pricing Formula
Bundle Price = (Cost of Ingredients for All Items)
(÷) Food Cost Target
Example: A pizza ($3.50 food cost), wings ($2.25 food cost), and a soda ($0.50 food cost) would total $6.25 in food costs. With a target food cost of 30%, calculate the bundle price as:
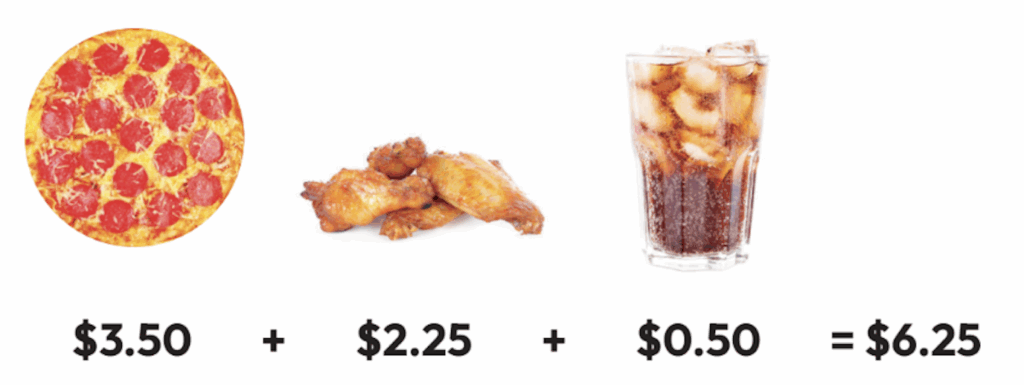
$6.25 / .3 = $20.83
Round up to $20.99 for market appeal
This formula ensures you hit your profit targets while delivering perceived value to the customer. A strong menu bundle pricing strategy can help you hit your profit targets.

3. TEST AND ADD MENU SPECIALS
Your menu analysis likely revealed interesting regional patterns. Use this information as ammunition to drive sales. Introduce limited-time promotions in suburban markets, paired with targeted digital ads, to gauge whether discounts could boost interest. In today’s deeply connected and networked world, you can be very targeted in your approach. Use your menu data to drive sales with individual marketing, menu, and upsell strategies designed for each store. Limited-time offers drive results and can be tested and evaluated for success.
Limited-Time Offer Formula:
LTO Price = (Ingredient Cost + Marketing Cost per Unit)
(÷) Food Cost Target
Example: A $4 dessert with $0.50 in marketing costs
would be priced at:
($4 + $0.50) ÷ 0.30 = $15
Round to $14.99 for market appeal
This formula ensures you are accounting for the added marketing spend while maintaining profitability.
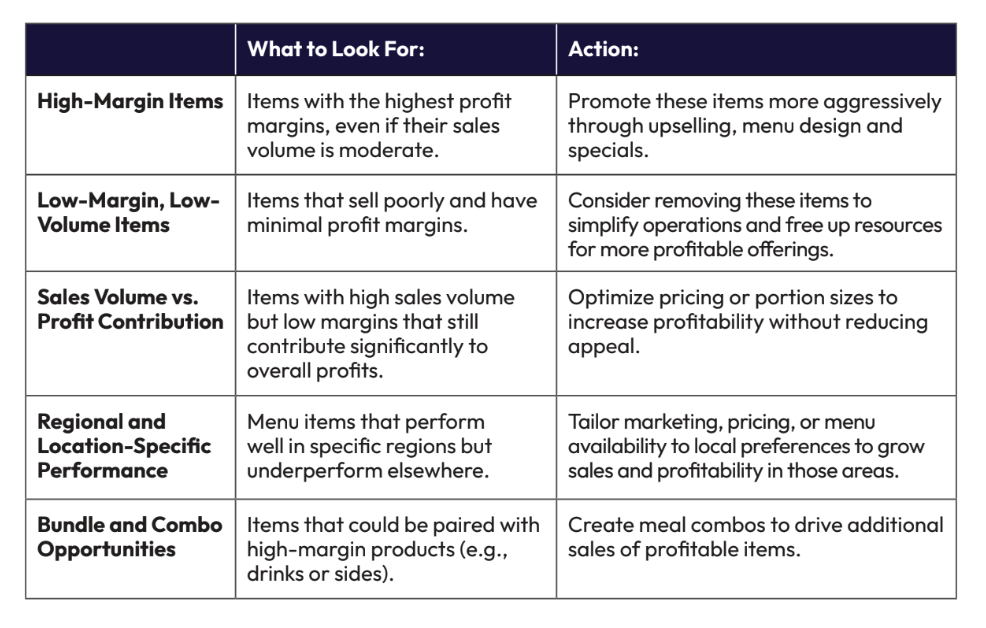
Targeted Menu Optimization
Your menu analysis from Step 1 identified key opportunities— uncovering insights with the potential to drive growth. You can now put those insights to work for you.
The following is a list of performance signals you can look for in your data to turn it into actionable insights.
A version of this essay appears in Bill Mitchell’s Restaurant Leader’s Playbook.
Want to get the full step-by-step guide for transforming restaurant operations?
Restaurant Menu Performance and Optimization Strategies FAQ
How do you assess menu performance in a restaurant?
Assessing restaurant menu performance involves analyzing sales data and profit margins for each menu item across locations to identify which items drive the most profit and which need improvement. It helps restaurant operators make strategic decisions to optimize their menu for profitability and guest satisfaction.
Why is menu analysis important for restaurant growth?
Menu analysis uncovers hidden profit opportunities that might otherwise go unnoticed. By reviewing sales volumes and profit margins, restaurant leaders can focus on high-performing items, remove low-margin dishes, and introduce strategic bundles or promotions, driving higher overall profitability.
How can POS (Point-of-Sale) reports help optimize my restaurant menu?
POS reports provide critical data on sales volume and profit margins per menu item. This data allows operators to identify bestsellers, underperformers, and high-margin items that can be promoted or bundled, leading to smarter menu decisions and improved profitability.
What should I focus on when analyzing menu performance?
When assessing menu performance, focus on:
- High-margin items with low sales volume (opportunities to promote)
- High-margin, high-volume items (core drivers of profit)
- Low-margin, low-volume items (candidates for removal)
- Regional variations in item performance
How do I decide which menu items to remove?
Items to consider removing include those that:
- Have low sales volume and low margins
- Cause operational complexity
- Don’t align with guest preferences or current market trends Removing such items simplifies kitchen operations and boosts overall profitability.
How does bundling menu items increase profitability?
Strategic bundling (e.g., a drink + side + entrée combo) increases perceived value for guests while boosting average ticket size. Bundling high-margin, easy-to-prepare items also improves operational efficiency and drives greater profit.
What role do limited-time specials play in menu optimization?
Limited-time specials help test new menu items or promotions based on regional tastes and trends. They create excitement among guests, drive short-term sales boosts, and provide valuable data to inform permanent menu updates.
What are some quick-win strategies for boosting restaurant profitability through menu changes?
- Remove complex, low-margin items
- Promote high-margin, low-selling items
- Bundle popular menu items with high-margin sides or beverages
- Launch regional limited-time offers
- Train staff in upselling techniques based on menu data