
A version of this essay appears in Bill Mitchell’s Restaurant Leader’s Playbook.
Want to get the full step-by-step guide for transforming restaurant operations?
By Bill Mitchell, HungerRush CEO
Gain Data-Driven Clarity
You’ve built a successful restaurant business and are now focused on sustaining your brand for decades. Yet, challenges like rising labor costs, increasing food prices, constantly evolving guest expectations, and intensifying competition for customer loyalty make this more difficult than ever. Although you may have strategies in place to grow your business and improve margins, a comprehensive evaluation of your entire operation can ensure you’re focusing on the right areas and making decisions that continue driving the kinds of results your business needs to thrive.
Transformation is about building clarity—it starts with identifying your all-star locations. The insights you gain from examining what makes them work will serve as the foundation for scaling your brand and positioning it for long-term success. And even if you’re the owner of a single location, the data-driven approach outlined here can still help transform your business.
I. BUILD YOUR OWN BENCHMARKS
Locations will never perform equally. The goal is to identify the top-performers —those excelling in revenue, labor efficiency, or customer satisfaction—understand why they are outliers, and work to replicate their success across all stores using their own performance metrics.
The data doesn’t lie. However, you need to know that you are working with accurate data. Top-performing brands measure every critical metric they have established for themselves regularly (often down to specific times of day) because regular, accurate data enables informed, timely decisions that drive results. This is where restaurant KPI tracking and real-time restaurant data become essential tools. The ability to easily gather and compare reliable data across locations is essential for identifying what’s working and where there’s room for improvement.
How do you build the benchmark data by location that matters to your business?
Start by conducting a comprehensive analysis to evaluate how your brand is performing right now. The goal of this analysis is to identify top-performing locations that set the standard for success and uncover opportunities for growth in others. These will be the benchmarks for your other locations, powered by centralized restaurant reporting.
Key Restaurant Data Metrics
You can use your POS data to grow your restaurant. Compile the following key metrics from all locations over the past 365 days to create a clear picture of current performance.
Gross sales and individual menu item sales
Pull sales data broken down by day, week, and month for the past 365 days. If available, include two years of data to identify cyclical trends. Note spikes in sales due to seasonal patterns. Additionally, analyze sales figures both pre- and post-discounts to determine if promotions are driving success or eroding profit margins.
Labor costs as a percentage of gross sales
Collect monthly and yearly labor cost data from the past year. Assess each location’s adherence to the industry target range of 25%-35%. Develop improvement plans for locations outside this range.
COGS (Cost of Goods Sold)
Calculate the total cost of goods sold for all locations over the past year. Use this data to identify inefficiencies and implement strategies to optimize costs.
COGS as a percentage of sales
Review COGS as a percentage of sales for each location over the past year. Identify locations that exceed the industry standard of 25%-30% and create corrective action plans to address the issue.
Customer satisfaction scores
Compile guest feedback from all sources, including Google, Yelp, your website, and in-store feedback cards for the past year. High customer satisfaction scores, especially on platforms like Google Reviews, are directly linked to increased topline sales.
Why the Right POS System is Important
To put these key metrics to work for you, you must be able to compare apples to apples. How do you track these key metrics across many locations? A centralized POS system with strong analytics capabilities can automate much of this, pulling together labor, inventory, and sales data into one cohesive view. But if the brand is using different reporting tools across locations, gathering consistent data is difficult.
In today’s world a modern POS needs to be able to do these things for you: accurate inventory tracking, actual food costing, and theoretical food costing.
If your POS doesn’t do these things for you, then managing your menu and optimizing your business will be difficult.
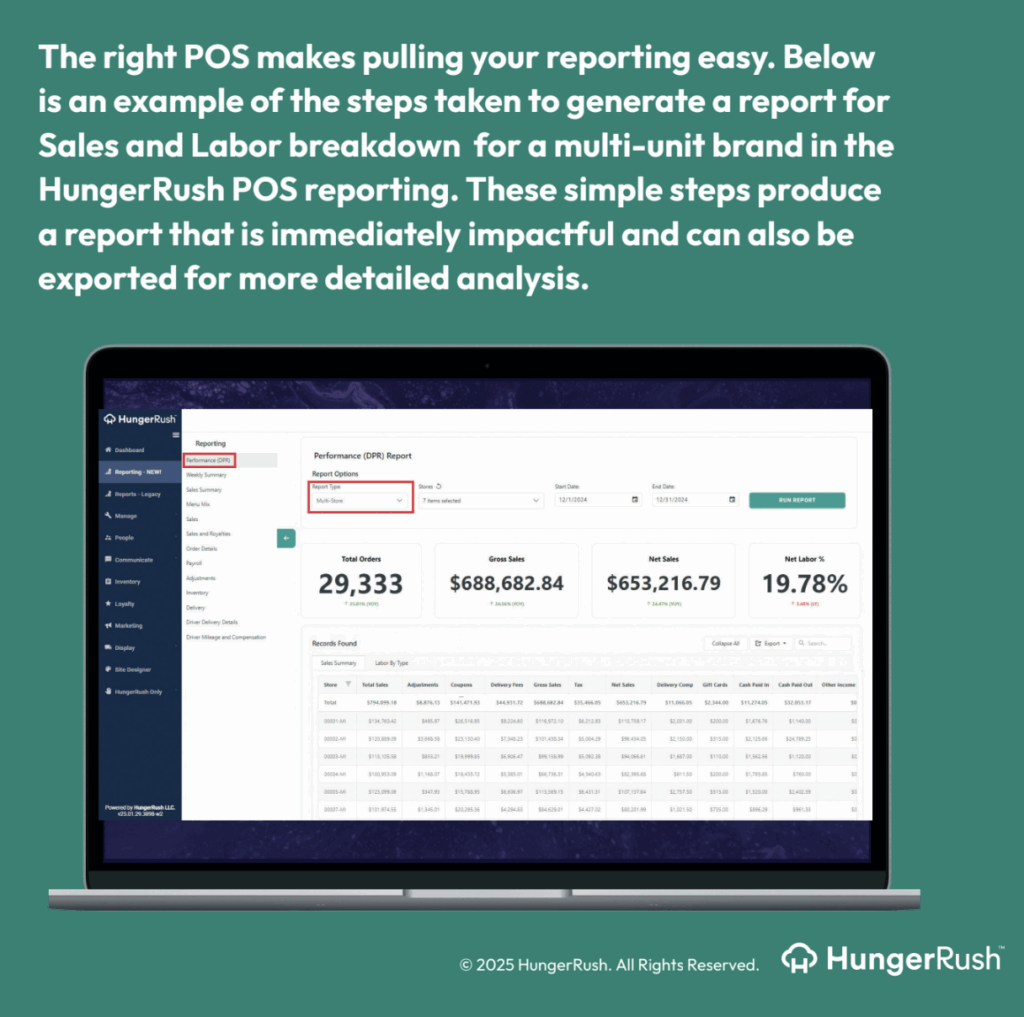
The right POS system for multi-location restaurants makes pulling reports across multiple locations easy. Below is an example of the steps taken to generate a report for sales and labor breakdowns for a multi-unit brand in HungerRush POS reporting. These simple steps produce a report that is immediately impactful and can also be exported for more detailed analysis.
II. ANALYZE AND RANK LOCATIONS
Now, it’s time to turn data into insights. How do you analyze restaurant sales trends? To evaluate location performance, rank locations by category and group them depending on how they score. Sales and transaction health are especially important starting points for recognizing excellence and diagnosing problems. Only have one location? The metrics listed above for your location are the keys to your success.
Start with a simple ranking system for your locations. Look at the key metrics listed above, and organize your locations based on the data you collected from the POS system.
| Top Performers | Middle of the Pack | Lower performers | |
| Gross sales | |||
| Labor as a percentage of gross revenue | |||
| COGS as a percentage of sales | |||
| Customer satisfaction scores |
When you consolidate these scores, the top-ranking stores overall become immediately clear. Making a store-level data comparison and identifying the strengths and opportunities for each location shows the entire picture and easily highlights areas for improvement. The most important metrics for identifying the health of a store are sales and transaction health. If stores are struggling with sales and transactions, that’s the area to diagnose first.
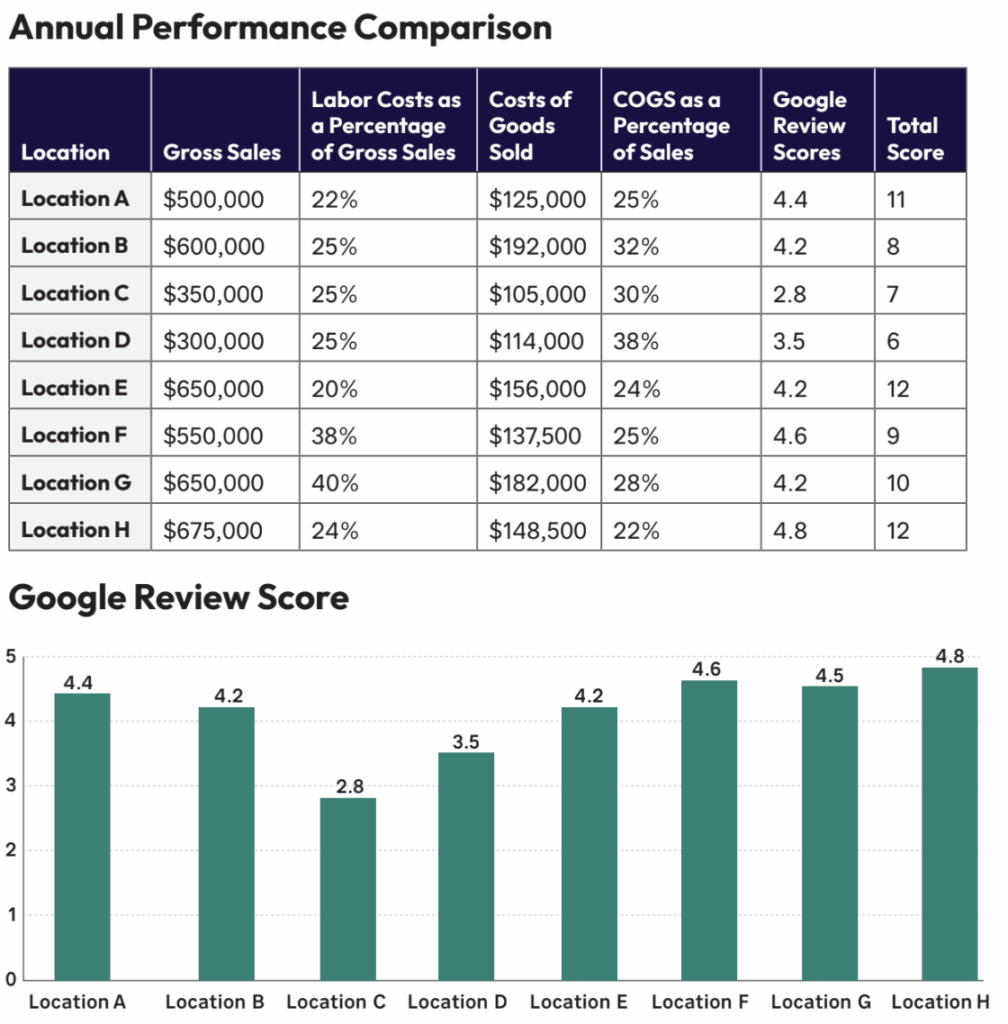
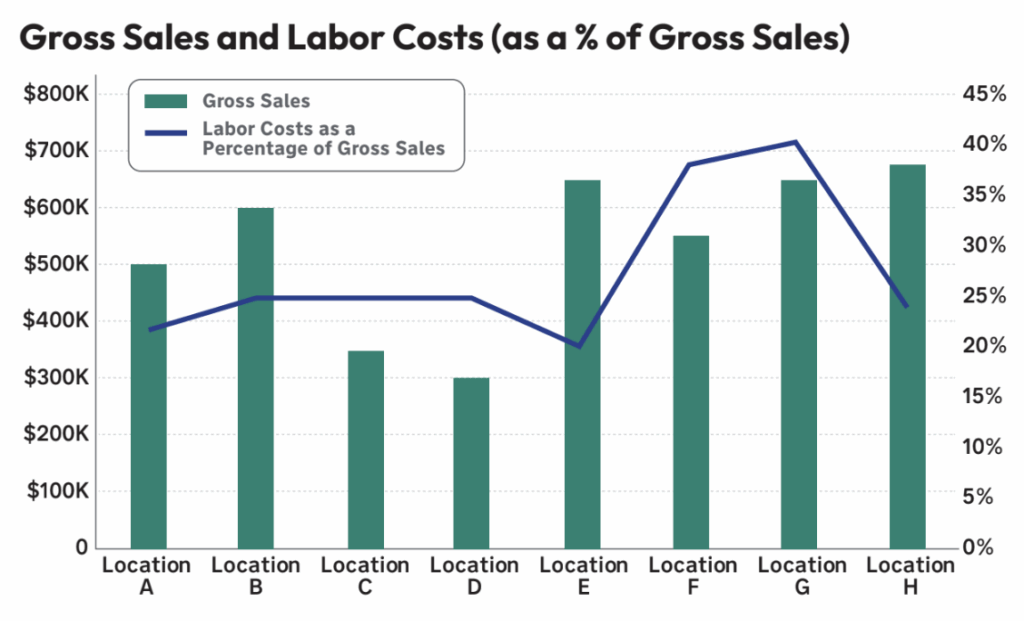
Below is an example of how a brand with 8 locations might look. Be sure to also review your online scores for each location. Is there a correlation between Google review scores and restaurant revenue?
Improving Restaurant Operations with Data: Annual Performance Comparison
You have your actionable restaurant insights, now what do you do with the data?
Depending on your specific findings, you may develop different sets of action plans.
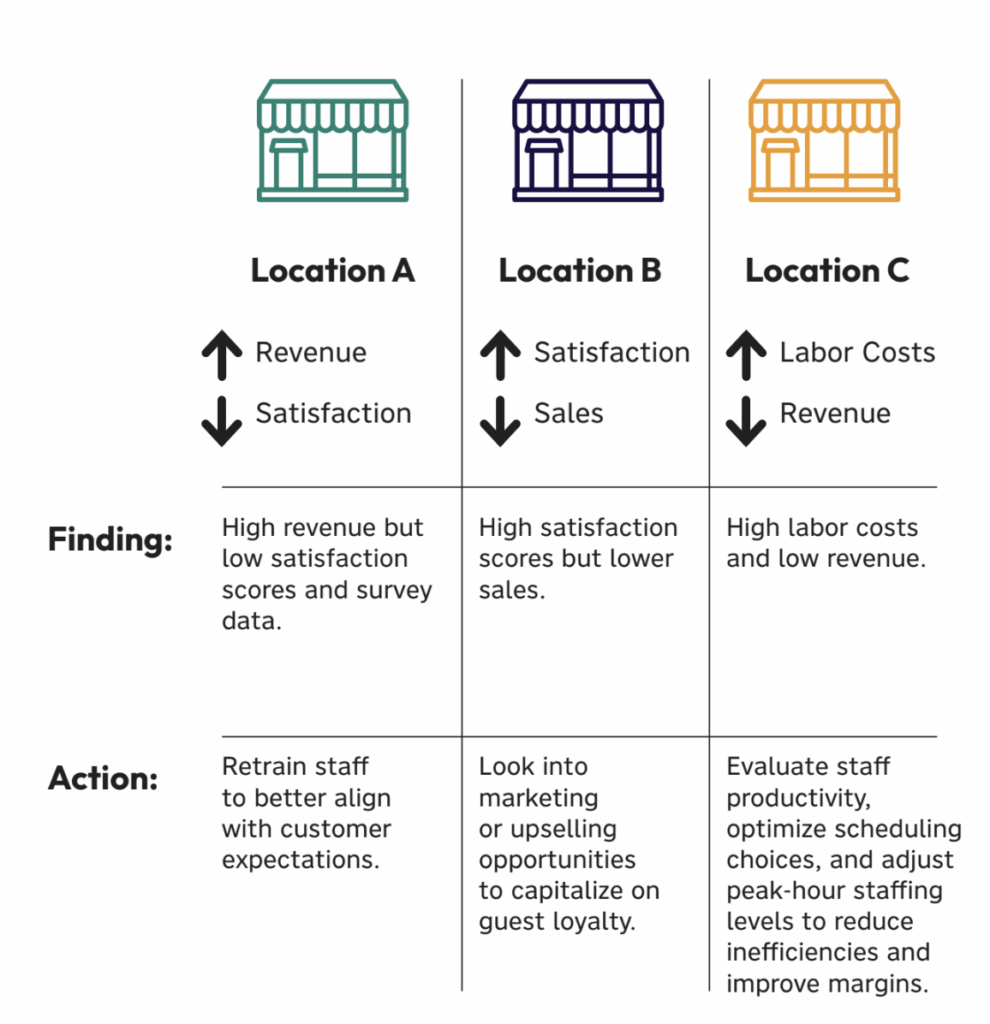
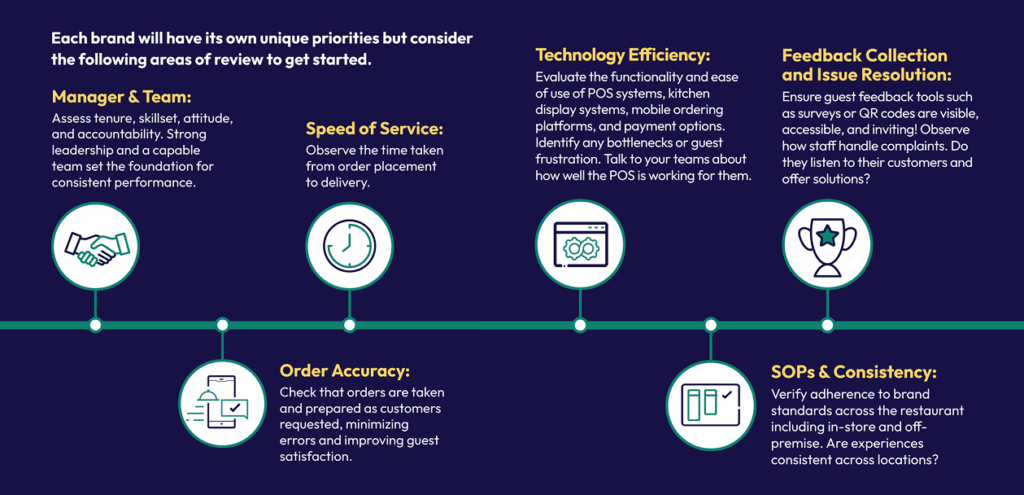
Each brand will have its own priorities, but consider the following areas of review as you get started.
Want to learn more about mastering restaurant data? Check out our article on the five pillars of restaurant operations data mastery.
Go See for Yourself
While performance data offers critical insights, visiting locations is essential to fully understanding operations. Visit both high-performing and low-performing stores to conduct site audits that reveal nuances data alone cannot provide. Use these visits to connect with operators, understand their pain points, and identify what is or isn’t working. Only have one location? Stay alert to the trends you see in your restaurant.
A version of this essay appears in Bill Mitchell’s Restaurant Leader’s Playbook.
Want to get the full Playbook for restaurant transformation?
Restaurant operations performance metrics FAQ
1. What are the key performance metrics for evaluating restaurant locations?
Top restaurant performance metrics include gross sales, labor costs as a percentage of revenue, cost of goods sold (COGS), and customer satisfaction scores. Tracking these metrics consistently across all locations helps identify high-performing stores and areas needing improvement.
2. How can restaurant data analytics improve multi-location restaurant operations?
Restaurant data analytics provide visibility into individual store performance, allowing operators to benchmark success, uncover inefficiencies, and replicate top-performing strategies across all locations. With the right restaurant POS and centralized reporting, you can make more informed, scalable business decisions to grow your brand.
3. Why is it important to identify top-performing restaurant locations?
Identifying your “all-star” locations helps you understand which stores are driving the most value through sales efficiency, labor management, and guest satisfaction. These locations serve as internal benchmarks and models for operational excellence across your entire brand.
4. How does a POS system help track restaurant performance metrics?
A modern POS system like the HungerRush POS system centralizes data on sales, labor, and inventory, making it easier to generate actionable reports and monitor KPIs in real time. POS reporting tools are essential for comparing performance across locations and implementing data-driven improvements.
5. What is the connection between Google reviews and restaurant sales data?
Higher Google review scores often correlate with increased customer loyalty and higher sales performance. Comparing review data to sales metrics helps identify the impact of customer experience on revenue and pinpoints areas where service improvements can boost profitability.